


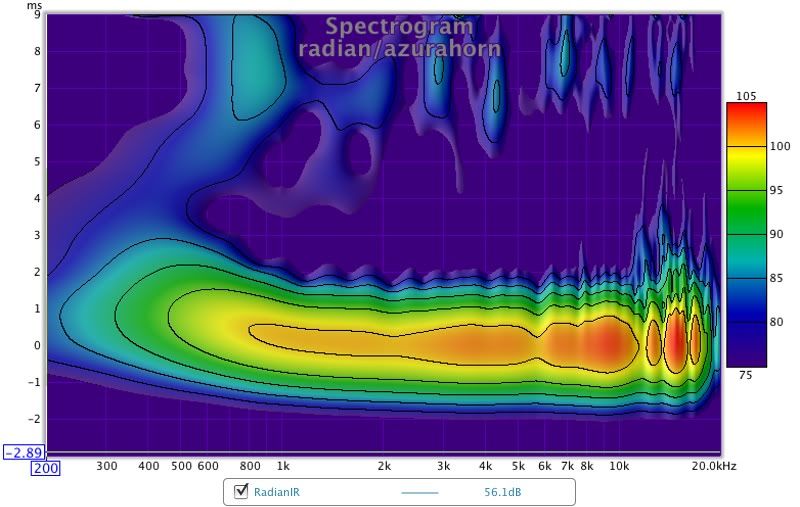
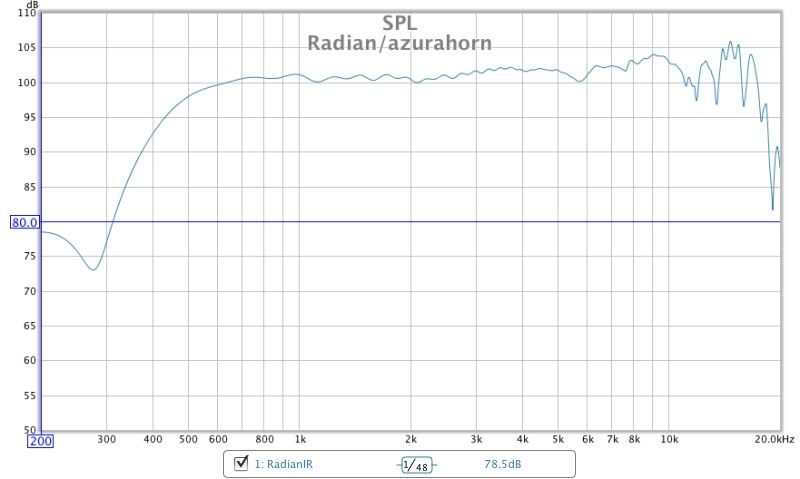
So you want to get a nice clean measurement to design a speaker or measure a speaker you already have and you don't have an anechoic chamber at your disposal. Kind of a conundrum. You need a pseudo-anechoic measurement, but how does one make a pseudo-anechoic measurement? Eazy Peazy, you have to gate out the room reflections. IOW, remove the reflections out of the visible frequency response measurement. Since sound has a time element to it--it is a temporal thing, we'll have to look in the time domain to separate it out. In order to do that you need to see what is speaker generated and what is boundary/room reflection generated. The frequency responses at your left were achieved by various levels of gating using either the impulse or the spectrogram to discover where the room reflections enter the response. You can essentially close the gate on the reflection trying to get into the graph. In the impulse you can see where the major, high amplitude reflections come into play just after 6 ms, but the spectrogram makes things a bit clearer if a bit less absolute. In the spectrogram you can see not only the timing and frequency of the reflections, but their amplitude as well. Gating not only removes room reflections, but also the amount of data points in the measurement. So the longer the gate, the more detailed your gated measurement. As you look at the frequency response graphs and how they are gated, you can see the impact of the time and amplitude of the reflections shown in the spectrogram at that gate setting. You can try the same thing for any speakers you would like, but there are other ways as well. Read on.........
For woofers and mid/woofers, gated measurements can be less easy to be exact and the resulting frequency response graph becomes less accurate in the low end d/t reduced resolution effects of less data points. Good thing that there typically aren't huge problems in this frequency band d/t the relative rigidity of the cone and our perception of this range is dominated by the room anyway (barring baffle step).
The triangle in the top picture is the key to the math though the above(impulse) method is more useful--Pythagoras is your friend. 'A' squared + 'B' squared = 'C' squared. There are 2 right triangles in the pic above, just draw a straight from the midpoint to the floor and use it as 'A' or 'B'. The time difference between the arrival of the direct sound and first reflection is how you set your gate (reflected time-direct time=gate length). Sound travels at about 1ft per ms or 1 meter per 3 ms. Frequency Resolution of your gated frequency response = 1/Period(Gate). Let's say after you do your Pythagoras, a 6 ms gate is given(which would be excellent for in home). This limits your lowest frequency measured and resolution to 166.67Hz. Call it 170Hz. At 3 milliseconds your resolution becomes 333Hz or roughly 350Hz. You'll be able to get a longer time period/cleaner measurement from higher directivity speakers as the reflections won't be as powerful. The closer your mic is to the speaker and the higher the speaker is off the ground, the longer the gate you can have. However, the big chiefs in the industry say you need to get the mic away from the speaker for appropriate wavefront formation in the low end so it can be far field.
That looks like REW! Are you using REW for gated response? It's not well set up for it but appears you can actually do it. If you are using Mac then Fuzzmeasure is a good one to try. I use PC but I've seen it used and it's a very intuitive program. Fuzzmeasure and Holm Impulse let you see the impulse response to choose the gating.
ReplyDeleteYea, you can do it with REW as it does the same as Fuzz and Holm. I've got Fuzzmeasure but actually prefer REW. It's just more intuitive and actually has more ways of looking at the impulse--or at least it did last I updated Fuzz.
ReplyDeleteHmmm. Very interesting. We'll see what the NS-10s do in REW and this gating business. It's going to be funny when the curve isn't all that interesting anymore.
ReplyDeleteThe other thing you can do to make the curve uninteresting is smoothing. You can make any speaker's graph look great with enough smoothing. Heavily smoothed graphs are about the only ones manufacturers will show if they show any at all.
Delete