Feel free to ask questions. I'll do my best to answer.


Tuesday, July 27, 2010

Decay and Diffraction


Gruesome title eh? Just a little side by side of the decay from 3 Behringer monitors.
Note the 1030A has the most reflection showing followed by the 2031P with cotton and the 2031P without cotton being the cleanest. So as you go lower in frequency and the dispersion gets more broad, the accuracy will be less precise for the graph with cotton and even more so for the 1030A. Also notice that the 1030A will get more reflections in the graph d/t its wider dispersion until the top octave.

Another Cheap Behringer Monitor


I just did some routine measurements on the Behringer 1030A monitor. This thing looks pretty good on paper and the sound matches. This particular one unfortunately has a noticeable rattle while doing the frequency sweeps that wasn't heard with music and a sporadic treble distortion that is more frequent when the treble boost is engaged. t took me some time to figure out that the treble distortion was actually on the recordings I was listening to. I am just barely able to hear it on other speakers. This is not really a fault of the speaker except that it will expose problems on recordings that may have escaped the producers of the recording. The top is the vertical polar response toward the tweeter followed by the vertical polar toward the woofer. A fairly broad vertical lobe for such spacing. Next is the impulse response which is very clean and the horizontal shows a generally broad pattern with some degree of beaming in the top octave. Certainly no major diffraction issues here d/t the sculpted baffle.

Monday, July 26, 2010

My Room Response


Here's the Frequency Response from three positions across my couch which is caused by the polar response from the B2031P and my 2 Allison subs. That bass end needs some work but that's typical.

Audiophile Buzzwords, a dicey subject

How can loudspeaker measurements tell us anything about how a speaker sounds? Audiophiles generally don't think in terms of Polar Response, Impulse Response, Power Compression, etc...
They tend to look at things in subjective terms and often confuse musical terminology, Pace, Rhythm, Timing, Sound Stage, Dynamics, Spaciousness, etc.. for engineering possibilities and vernacular. This is a crude attempt by an amateur, myself, to bring these 2 worlds together. I won't go through all the buzzwords, just a couple to make my point.

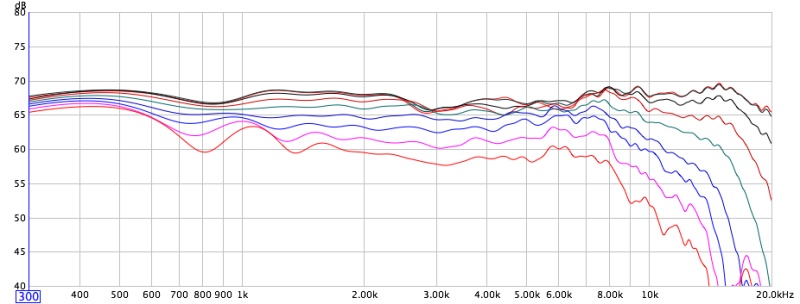
Tonality can be looked at from many different metrics, but basically a polar response and impulse response will tell you what you need to know. Some people would argue for phase as well, but the science refutes that claim.
Look here for a good explanation what tonality is: http://en.wikipedia.org/wiki/Tonality
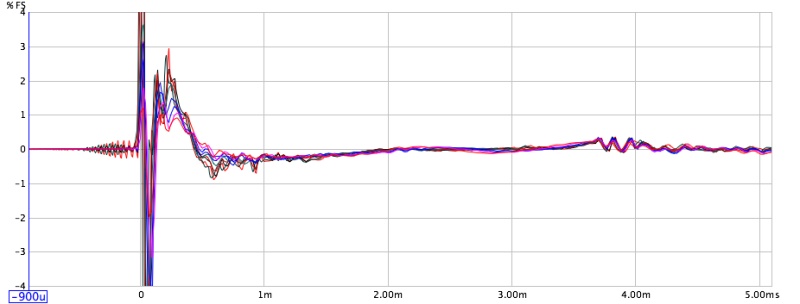
and you'll realize this is a music term, not a playback term. That said, wild polar responses will not have good tonality unless they somehow match the inaccuracies of the recording process--fat chance. If it does on one, it won't on any other. The recording process has as much to do with this as the playback. That's part of the reason why getting a polar response on a speaker is more useful than going and listening to your few favorite tracks. Rise time and Decay should also play a part and can be seen by looking at the impulse graph, CSD, wavelet, etc... With the impulse(s) and a polar plot, you'll have all that info.
What most people seem to describe as soundstage as far as I know mostly has to do with speaker placement and polar response. If you are shooting an even sound across your room and your room and your speakers are placed with the left on the left and the right on the right, away from the walls toed in, I can't see where you could go wrong. A narrow directivity should give you a better image where a wider, a better sense of space.
Spatiousness is another one of those touchy definitions. To me that's mostly reflection above the modal region (search for "Haas Effect" and the "psychoacoustics" post on this blog http://dtmblabber.blogspot.com/2010/12/psychoacoustics.html) and low level detail resolution if you're talking about what's actually contained in the recording. IOW if you want to hear the recording environment as picked up by the microphone and diluted or enhances through the process of production. Which means anything that interferes with that can have an impact. So from the loudspeaker standpoint, impulse, cabinet accelerometer CSD, now it even looks like capacitor vibration(so there may well be credence to more tweaks like God forbid, cables! Nothing has turned up there yet that I know of), and polar response will play into everything. In Dr. Toole's book there are studies that show wider dispersion adds to a sense of spaciousness. It seems rather intuitive. Also contralateral reflections play a role and subsequent elevations in IACC factor in. There are many things that can effect the low level resolution. I'd bet to some degree you can trace this all the way back to the source. This may be the most expensive, difficult and time consuming part to get to the "N"th degree. The room itself is also a large part of this.
Transient response is another one of those CSD, Wavelet, Impulse, polar. It's just rise time and decay. A CSD or Wavelet don't tell us a whole lot without the impulse response--ever really that I can think of.
Dynamics is another interesting topic that depends on wether you are talking physical or psychophysical. The best way to look at this graphically would go back to everything mentioned for transients, then also thermal capacity, power compression and efficiency.

I know, no publisher of specs is giving you this information, so knowing how to use it or think of it is of little use. In the end we are all left to guess. I wonder if informed guessing is better than uninformed. I bet anyone schooled in the issues at hand could do much better than I. Every time I read something new, I learn more and I'm betting any recording engineer, acoustician, transducer engineer, etc... could do a much better job than I just did.


Friday, July 23, 2010

Decay


So The port stuffing made an obvious improvement in the response. Another view of the change is rate of decay. According to the psychoacoustic studies, the Cumulative Spectral Decay plot, or CSD, does not display the more audible delayed outputs. A Spectrogram would be more relevant. The top 2 graphs on the left are of the 90 degree off axis plots and the bottom 2 are on axis. You can see the cotton make the decay slightly faster but since the first reflection point of the graphs with cotton is sooner, there is a bit more noise late in the graph which contaminates the results. That can be reduced by graph manipulations, but left in for demonstration. Basically these don't tell us anything other than what the Frequency/Impulse Response tells us.
They just shed a different light on the situation.

Thursday, July 22, 2010

Bass changes from port/enclosure stuffing


OK, so Here's what happened on the low end of the spectrum coming from the B2031P speakers with the various modifications. The top graph is 2 inches from the speaker. When the ports are stuffed with cotton, you'll see the elevation of the low end. The next graph is 2 feet from the speaker. Here, the ported box actually has a bit more output.

More on the B2031P and diffraction


I also wanted to test my diffraction theory with the ports next to the tweeter. So I got some cotton balls from the "stuff" drawer and filled the front of those ports with white cotton balls! Well, the results are something to see. The top polar and impulse graph are prior to port stuffing. The next are after the cotton balls were installed.  Now I'd say it doesn't look like the woofer break up was any problem.

Wednesday, July 21, 2010

Inside the B2031P


Here's a look at the Behringer monitor. I'll get some stuff to do modifications and see if it makes a measurable difference. I'm going to try and generate some plots using the new REW so we can get a better look at resonance issues. The crossover looks like a minimalist WGed 2-way with just a cap and resistor in the tweeter with a 2nd order low pass.  The active version should do much better in this regard even though there's not a huge problem in the passive version. We see poly caps, an iron core inductor, and a wirewound resistor. The baffle is stout on the woofer half, but thinner on the tweeter. Enclosure damping is certainly less than I've ever used. That may be where we could best improve the design.

EDIT: The break up is benign on this cone!  Response issues are caused by the enclosure/ports next to the tweeter.

A list of sites for the Home Theater/Audio enthusiast

For the sake of saving money, it's probably a good idea to read some of the studies that have been done on the audibility of components and tweaks and how to set up your room to maximize your investments potential. If you have any interesting links, feel free to send them to me for posting. This is the short list of what I've found most insightful.

This site has the most DBTs in one site I know of:
Everything from capacitors and wire to amps, speakers, and cd players. Juicy stuff in the audio community.

Here's another dealing with amplifiers:

SBT that agrees with previous findings:

A video from Ethan Whiner that is very interesting:

Ethan's room advice:

Dr. Olive's Blog is full of great information:
Search around, it is one of the most useful sights on the web.

This will trump all the web searching you can do.

Tuesday, July 20, 2010

Surround Damping


So then I treated the surrounds to damp the excess vibration. Looking at paper cones with accordion surrounds, the surrounds have a tacky, tar-like substance that stays sticky for a long time. I looked around and found Aleen's Stretchable-Flexible Fabric glue. It seems to retain it's tackiness for a few months now anyway--Ha ha. I also thought that since it was designed to remain flexible for a long, long time. Well check out the results.

Cone Stiffening


So I looked into what was causing this poor cone behavior. As it turns out, it starts where the cone meets the surround--the rim resonance. That's where the cone starts to flip out and behave in erratically. So in order to raise the frequency when this starts to happen, the cone needs to be stronger. So I painted a few layers of Mod Podge Hard Coat to the cone and waited overnight to take the measurements shown to the left. You can see the rim resonance is higher and the impulse is more compact.

interesting references:
http://madspeaker.com/page2.html

http://voicecoilmagazine.com/media/klasco409.pdf
http://www.vibroacoustics.co.uk/audio/fsacbens.htm

http://www.nutshellhifi.com/library/speaker-design2.html
http://www.loudsoft.com/default.asp?site=FINECone.asp
http://www.klippel.de/measurements/sound-radiation-and-propagation.html

Cone Damping


So, looking at the narrow directivity speaker below that just couldn't work out no matter what I tried electrically. Trying to make a notch filter too deep or too narrow will eventually backfire and it will become less deep. Remember the old adage, "you can't make a silk purse out of a sow's ear." Well I tried another route. Let's take a look at what I started with for experimentation. Shown are the average of measurements from the polar response, the impulse response, and the polar response.

The Listening Window


The first three graphs are taken sequentially from 11.25 degrees to 33.75 degrees off axis.


Then the speaker was placed on its stand in its normal position.


The last 2 graphs were taken from the far ends of the listening couch and gated for distance and smoothed to hide the effects of comb filtering.


The spectral similarities are apparent.

Woofer Break Up Effects on Narrow Directivity Speakers


To make a speaker with narrow directivity and a smooth transition in off axis response from woofer to tweeter, you generally have to crossover very near the woofer's break up region. The more narrow your waveguide's directivity, the nearer the woofer's break up will be to the crossover.

The top graph is polar response in 11.25 degree steps of the 10" Dayton waveguide, which the speaker is designed around, loaded by the Selenium D220t.

The initial "Rim Resonance" and how the woofer handles it is crucial in these types of designs. Finding the best woofer or even a good one is currently impossible using published graphs.

The second graph is of a woofer's polar response--not a particularly nice one. The next is after a make shift notch filter is added in line.

Then we have the respective responses after the low pass filter is added.

The final 2 graphs show what happens to those responses when the Waveguide is added. If the woofer's break up is as nasty as this one's, all is not lost as I'll demonstrate later.

You can see that a perfect off axis transition is impossible with this combination in its present state. The notch filter does improve it however.

Effects of Stuffing a Loudspeaker Enclosure

Here's 2 graphs of woofers placed in a sealed enclosures. Can you guess which ones have fiberglass insulation stuffed inside and which do not?


Delayed Energy in the Behringer B2031P


Here's the Impulse Response for the five B2031P studio monitors that I've measured. The graph shows how fast the output of the loudspeaker decays. Many factors effect this including resonance in the cone/surround and enclosure. A compact Impulse Response is then desired. You will also see at roughly 4 msecs the floor reflection. Notice the first graphs first reflection point is earlier than the others. It was measured under slightly different conditions. This notch, the first reflection, can aid you setting the gate on your time window when measuring a loudspeaker. You generally want to remove the first reflection from your measurement so it doesn't pollute your measured frequency response. The earlier your first reflection, the less resolution you'll be able to achieve.